
Manufacturing Analytics: From MES and ERP Data to Actionable Production KPIs
Availability from MES and utilization from ERP can both be correct and still refuse to reconcile. The cause is usually definition, not data quality — and the fix starts before anyone opens a dashboard.
- Big Data & Analytics
- Industial Sector
November 18, 2026
 AI Overview
Manufacturing analytics turns MES events, ERP records, and machine signals into production KPIs through four stages: collection, contextualization, modeling, and delivery. Contextualization binds each signal to an order, asset, and time model. Without that step, KPIs cannot be traced to a shared definition, and reported figures differ by department.

Manufacturing analytics combines shop-floor execution data with business system records to produce defined, auditable measures of production performance. It draws on MES events, machine signals, and ERP transactions, resolves them against a one time and asset model, and turns them into production KPIs a plant can act on rather than merely display.
Most manufacturers are not short of data. In the Manufacturing Leadership Council’s 2025 survey of manufacturing data practices, 91% of respondents named ERP systems among their data sources and 86% named shop-floor systems such as PLCs and DCSs, yet the most common analysis tool was Microsoft Excel, at 78%. Asked for their top three obstacles to data-driven decisions, respondents led with integrating data from different sources (46%) and extracting it from legacy systems (45%). Neither is an analytics problem. Both are plumbing.
What MES, ERP, and Shop-Floor Systems Each Actually Know
These systems disagree for structural reasons, described in a standard long before anyone built a dashboard on them.
ISA-95, published internationally as IEC 62264, organizes manufacturing into five levels: the physical process at Level 0, sensing and supervisory control at Levels 1 and 2, manufacturing operations management at Level 3 where MES and SCADA sit, and business planning and logistics at Level 4, the home of ERP. ISA’s description of the series notes that the standard “primarily deals with the interface between levels 3 and 4” — the substance of ERP-MES integration, and where analytics projects succeed or quietly fail. ISA published the current Part 1 edition, ANSI/ISA-95.00.01-2025, on 10 April 2025.
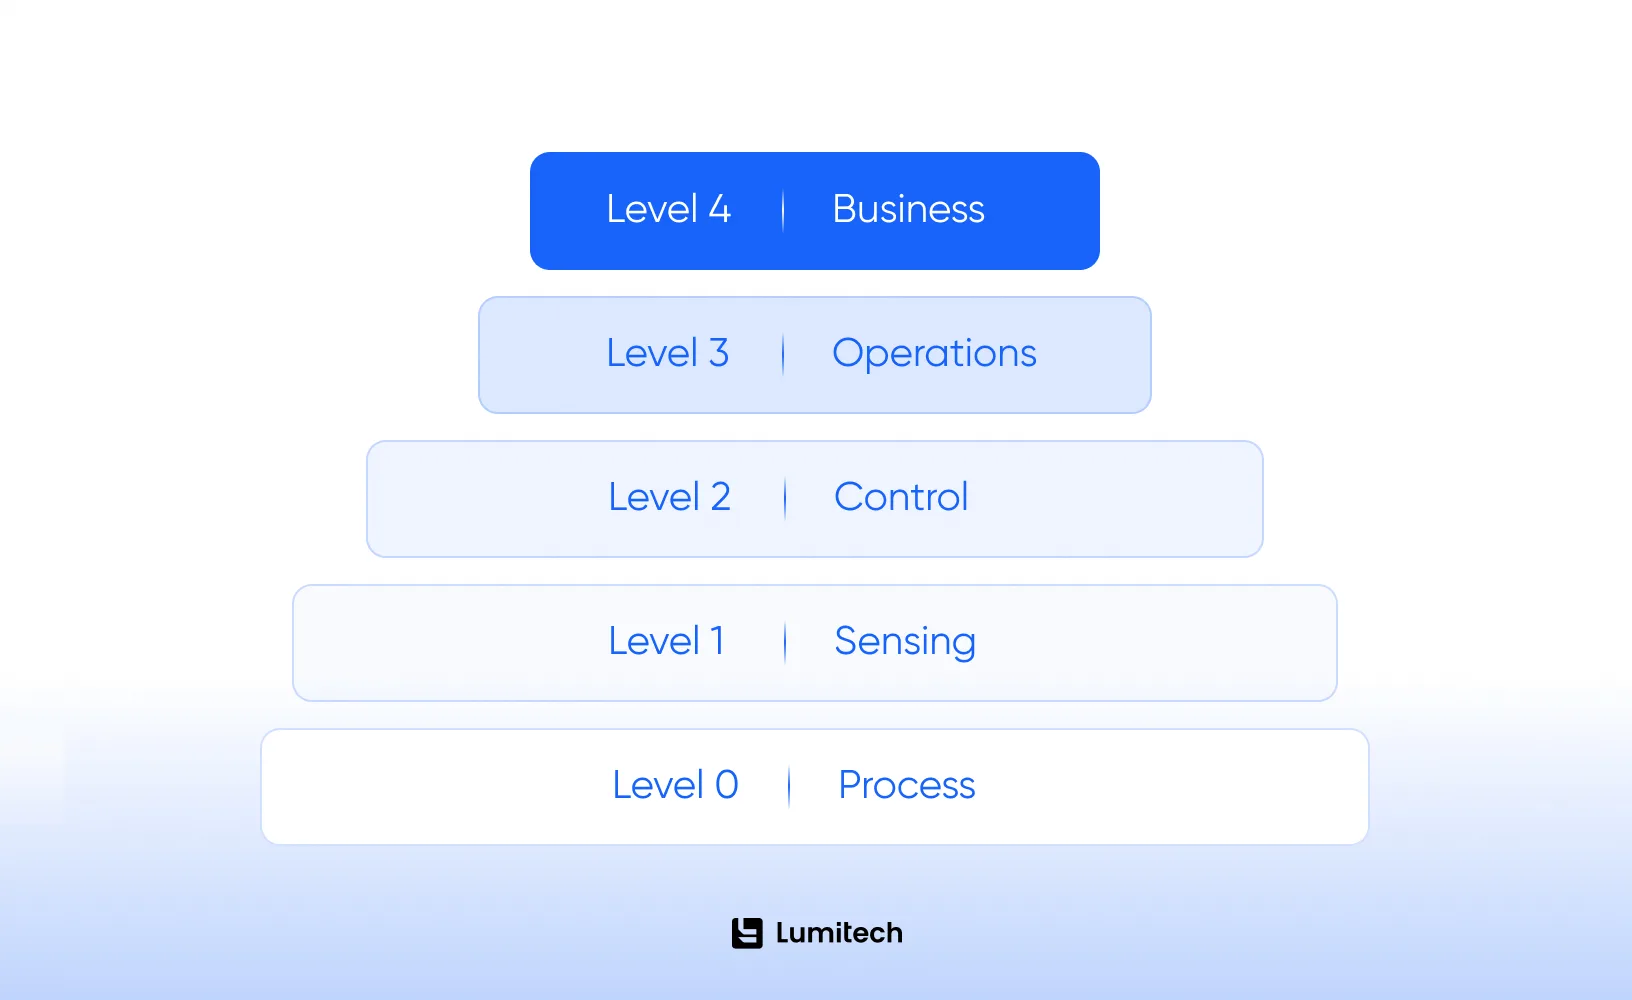
Each level holds a different kind of truth. Shop-floor systems hold high-frequency state — running, stopped, running slowly — but rarely know why, and never which order was affected. MES holds execution context: order, batch, operator, material, and the reason code entered against a stoppage. It is the first layer where a machine event can attach to a production order, which is what makes MES analytics meaningful. ERP holds commercial context at shift or daily granularity: cost, standard times, scheduled quantities, delivery commitments.
Shop floor analytics built only on Levels 1 and 2 reports that a machine stopped for eleven minutes, but not that the stoppage delayed a high-margin order. Manufacturing business intelligence built only on ERP sees the margin and never the eleven minutes. Useful production analytics needs both, joined correctly.
Why the Same KPI Produces Two Different Numbers
The most common failure at this point gets blamed on data quality when the real cause is definition.
ISO 22400-2:2014 defines KPIs for manufacturing operations management by formula, constituent elements, time behavior, and unit. Its introduction states that the KPIs it specifies “reside” at Level 3, and that Level 4 KPIs for business planning and logistics are “outside the scope” of it. So when MES reports availability and ERP reports utilization, and the two will not reconcile, both may be correct. The standard defines planned busy time as planned operation time minus planned downtime; a measure taken against that base will not match one taken against a calendar shift, and neither system flags the mismatch.
OEE: Where Manufacturing Data Analytics Definitions Diverge
Overall equipment effectiveness makes this concrete. In a 2020 paper in Computers & Industrial Engineering, Massimiliano M. Schiraldi and Martina Varisco analyzed the OEE definitions in ISO 22400 and reported that the standard “provides two definitions” of the indicator, versions that “seem to diverge one from the other and from the original Nakajima’s TPM formulation,” and that the standard “appears to be incomplete, and many relationships among the terms and the definitions are imprecise.”
Two consequences follow for any manufacturing KPI dashboard. First, OEE doesn’t compare well across sites: 75% availability, 85% performance and 95% quality multiply to the same value as 85%, 95% and 75%, yet those plants have different problems, so the decomposition has to travel with the number. Second, ISO 22400-2 sets each KPI’s range and trend direction but no target value, so the familiar 85% figure for world-class OEE is an industry convention rather than a standards benchmark. A revision is underway: ISO/DIS 22400-2 has passed its DIS ballot and is approved for registration as an FDIS, at stage 40.99 as of November 2026.
Write the definitions first. ISO 22400-2 defines each KPI by name, identifier, description, scope, formula, unit of measure, range, trend direction, timing, audience, and production methodology. Agreeing that across plants before building a manufacturing analytics dashboard removes most of the disputes that surface at the first review meeting.
Which Production KPIs to Instrument First
Every KPI below demands something specific from the systems underneath it. The right starting set is decided by which input you can already trust.
KPI | Minimum data required | Where it usually breaks |
|---|---|---|
Availability | Run/stop states plus an agreed planned-downtime calendar | Planned and unplanned downtime classified differently by shift |
Performance | Validated ideal cycle time per product, not per machine | Nameplate rates producing values above 100% |
First pass yield | Inspection results linked to producing asset and order | Rework counted as good, or caught only at final inspection |
Mean time to repair | Timestamped fault start and restart | Fault start taken from the ticket, not the machine |
Scrap rate | Scrap recorded at the point and reason it occurred | Scrap aggregated to shift totals, cause lost |
Schedule adherence | MES completions matched to ERP scheduled quantities | Order granularity differing between the systems |
Among the most valuable manufacturing analytics use cases is the least glamorous: making downtime reason codes trustworthy. An availability figure is only as good as an operator’s ability to classify a stoppage quickly, and most reason-code lists are too long or too slow to use mid-stoppage.
From Machine Tag to Trusted KPI
The path from signal to defensible number has four stages, and manufacturing data integration work concentrates in the middle two.
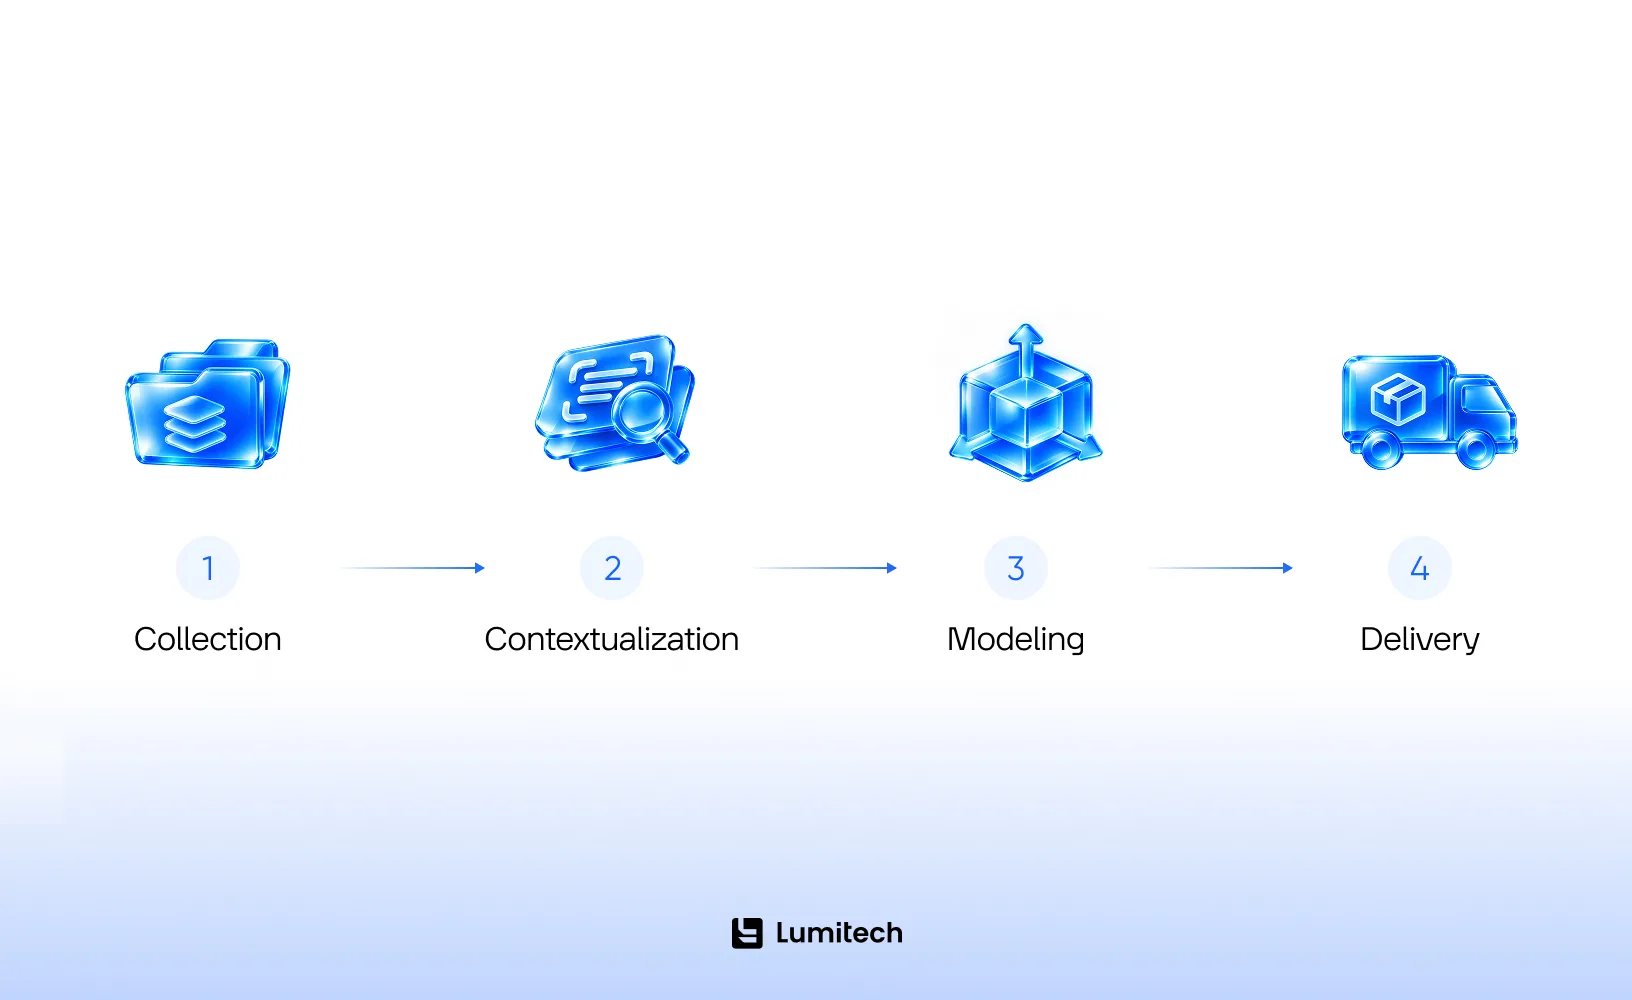
Collection. Signals arrive through OPC UA, MQTT, or direct PLC interfaces, often landing in a historian. Siemens’ The True Cost of Downtime 2024 reports that almost three-quarters of the manufacturers it surveyed still use factory historians, which it says are “seen increasingly as legacy technology.” Historians store high-resolution time series cheaply; they don’t carry business context.
Contextualization. Here a tag becomes a fact, bound to an asset hierarchy, a production order, a material and a time model — the stage that makes MES data analytics possible rather than merely available. The OPC Foundation’s OPC UA Common Object Model: ISA-95 exposes ISA-95 objects inside an OPC UA environment, and its stated limit matters: still at version 1.00 from November 2013, it covers “the role-based equipment, physical asset, material and personnel object models in ISA-95,” listing operations schedule and operations performance among models later revisions “may include.” The models most relevant to KPI reporting are not yet among them, so custom mapping remains necessary — industrial software development work that has to land before any KPI is defensible.
The Eclipse Sparkplug specification addresses the same gap on the MQTT side, defining an MQTT topic namespace, payload, and session-state management for real-time SCADA and control applications. Version 3.0 was released on 21 October 2022 and, unlike the OPC UA companion model, has since been published as the international standard ISO/IEC 20237 — worth knowing when procurement asks whether a connectivity choice rests on a recognized standard.
Modeling. The agreed definitions are implemented once, as shared logic rather than inside each report. This separates a production data analytics capability from a set of spreadsheets that happen to agree this month, and it is where manufacturing data analytics becomes repeatable.
Delivery. Dashboards, exception alerts, and write-back into MES. Manufacturing data visualization is the visible part and the smallest part of the work. Only here does real-time manufacturing analytics become a reasonable goal: streaming a KPI to a line-side screen is straightforward once the model exists, impossible while it is still a disagreement.
If your KPI figures change depending on who exported them, the problem is in the model, not the dashboard. Lumitech is here to help.

What the Evidence Supports on Downtime and Cost
Siemens estimates that the world’s 500 biggest companies lose almost $1.4 trillion a year to unplanned downtime, equivalent to 11% of their revenues, and puts an hour of downtime at $2.3 million in a large automotive plant and $36,000 in fast-moving consumer goods. Those figures rest on 181 online interviews with maintenance, engineering and IT professionals at large industrial organizations in four sectors — automotive, FMCG, heavy industry, and oil and gas — covering April 2019 to March 2023, and the trillion-dollar total is extrapolated from public plant and employee counts. Because each year’s sector mix differs, Siemens notes the combined results are “not directly comparable year-on-year and should be seen as indicative only.” They indicate an order of magnitude for large plants in those sectors, not a mid-market benchmark.
Its more useful finding is rarely quoted. Downtime incidents per plant fell from 42 to 25 per month and hours lost from 39 to 27, while average recovery time rose from 49 to 81 minutes — which Siemens attributes to harder-to-detect problems, loss of experienced maintenance staff and difficulty sourcing emergency parts.
That changes what manufacturing KPIs need to do. If the stoppages are less frequent but more difficult to diagnose, then the binding constraint is explanation: how fast a team can establish what happened, on which asset, under which conditions, affecting which order — a data-context question, answered by the modeling layer rather than by more sensors.
Scale of effort is the other underestimated variable. The World Economic Forum’s Global Lighthouse Network 2025 white paper, covering 189 sites designated by an independent panel of experts across more than 30 countries, notes that for every $2 those sites spend on technology innovation, they spend $3 on process debt reduction and $5 on scale and adoption. That’s the ratio they report for their self-selected group (no method stated), and they also state that most of the other producers spend one or two times their technology spend on those same enablers. In a manufacturing data analytics program, the platform is rarely the expensive line item.
Manufacturing Analytics Without Replacing MES or ERP
Replacement is rarely necessary, since the systems being replaced hold the execution context the analytics depend on. Most programs read from existing systems rather than through them, leaving MES and ERP as the records of truth; an analytics layer that quietly becomes a second system of record recreates the problem it was built to solve.
Three constraints decide feasibility: whether the MES exposes order and reason-code data through a documented interface rather than a private database; whether the historian retains enough history at enough resolution, since a credible baseline needs months; and whether asset hierarchies can be reconciled. The last is hardest, because ERP cost centers, maintenance registers, and tag trees rarely agree on what counts as one machine; reconciling them is system integration work, which is what digital transformation services address.
A Realistic Sequence
A first manufacturing data analytics build that produces one trusted number on one line beats a plant-wide rollout producing contested numbers everywhere.
- 01
Agree on the KPI definitions using the ISO 22400-2 structure, settling the time model first.
- 02
Pick one line and one constraint, preferably where downtime is expensive, and reason codes already exist.
- 03
Establish the asset and order model — tags to assets, assets to orders, orders to ERP records — and expect it to outlast the dashboard work.
- 04
Implement KPI logic once, centrally, not inside the reporting tool — the pipeline and data-quality layer data engineering services cover.
- 05
Validate against a manual count, investigating every discrepancy rather than adjusting the model to match. This step decides whether anyone trusts the system a year later, and it is the one most often skipped.
- 06
Extend to further lines, then to production data analysis on root causes, and only afterward to predictive work.
Validation against a manual count is the first thing dropped when a schedule tightens, and it is the step that decides whether the system is believed. When a figure disagrees with what someone counted by hand, the instinct is to adjust the model until the numbers line up, which defeats the point of checking. That discrepancy is usually telling you something true about the data model, and it is far cheaper to learn it in week six than in month eighteen.


For EU plants, there is now a legal lever as well as a commercial one. Regulation (EU) 2023/2854, the Data Act, has applied since 12 September 2025, and its Article 50 extends the access-by-design obligation in Article 3(1) to connected products and related services placed on the market after 12 September 2026, a date now passed. Recital 14 lists industrial machinery among the connected products covered, so for newer equipment, data accessibility is the supplier’s design obligation rather than a favor to request.
Where This Leads
The constraint on production analytics work is seldom the analysis itself. It is agreement about what a number means, and the engineering that makes that agreement hold across systems never designed to share a definition. Plants that settle the time model, the asset hierarchy, and the KPI definitions first end up with numbers people argue from rather than about — the precondition for any decision intelligence solutions layer built on top.
Once the measurement layer is dependable, more advanced work becomes realistic, from anomaly detection to condition-based maintenance. Our guide to enterprise AI in manufacturing covers that stage and why it rests on these foundations.


